Prince Rupert Regional Ocean Observatories
Starting in March 2016 Ocean Networks Canada, an initiative of the University of Victoria, began operating ocean observing and monitoring systems in Prince Rupert on Kaien Island, Digby Island, and Ridley Island. The systems include a seafloor observatory, two land-based oceanographic radar systems, and a weather station.
Ocean Networks Canada’s observing systems deliver freely available, locally-relevant environmental data in real-time for scientific research that helps communities, governments, and industry make evidence-based decisions on ocean management, marine safety, environmental monitoring, and education.
Situated within Ts’msyen Territory at Prince Rupert, the observing systems were collaboratively developed with the support of community members and leadership from the Metlakatla, Lax Kw’alaams, Kitselas, Kitsumkalum, and Gitxaala Nations, as well as the Port of Prince Rupert and the Port Environmental Stewardship Committee.
For more information, please visit www.oceannetworks.ca
KAIEN ISLAND
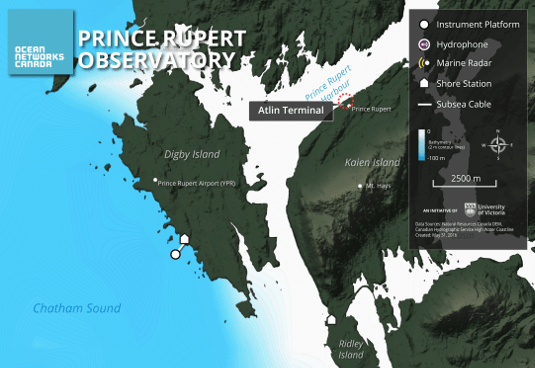
At the Atlin Terminal, Ocean Networks Canada and the Prince Rupert Port Authority deployed water quality sensors to monitor ocean health and biological productivity in the harbour.
Latest Readings
This table shows the most recently recorded data points from a selection of instruments at this location.
Fluorometer Instrument Data
View data with the ONC Plotting Utility
Fluorometers are water quality sensors that are commonly used in oceanography to measure chlorophyll, the pigment that the microscopic marine plants and plant-like organisms (called phytoplankton) use to produce food. By measuring chlorophyll in the water, researchers can assess ocean health and productivity of the upper layers of the ocean.
Turbidity measures how much matter is present in water and can indicate the health of an area. For example, water with lots of plankton growth is high in nutrients and turbidity, while an area with minimal nutrients and not a lot of plankton growth would have a low turbidity.
CTD Instrument Data
View data with the ONC Plotting Utility
A conductivity, temperature, and depth (CTD) instrument is a widely used oceanographic sensor that measures a fundamental selection of important and useful variables, including salinity, pressure (a measure of water depth), and temperature. Additional sensors (e.g. dissolved oxygen) are also added to this instrument
DIGBY ISLAND
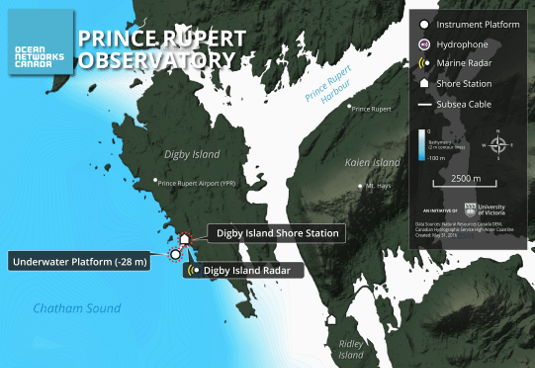
On the west side of Digby Island near the Prince Rupert airport, the Ocean Networks Canada’s community observatory includes an underwater cabled platform on the seafloor at a depth of 28 metres. This observatory is equipped with a live-streaming video camera, instruments that measure local water quality properties, and a hydrophone that records underwater sounds of marine mammals such as whales and the noise caused by ships transiting the area.
On shore, a weather station and an above-ground video camera track environmental conditions 24/7.
This location is also equipped with an oceanographic radar system (CODAR) capable of measuring surface ocean current speeds and direction, as well as an automatic identification system (AIS) antenna to track the location of large vessels.
Latest Readings
This table shows the most recently recorded data points from a selection of instruments at this location.
Fluorometer Instrument Data
View data with the ONC Plotting Utility
Fluorometers are commonly used in oceanography to measure chlorophyll-a, the pigment that the microscopic marine plants and plant-like organisms (called phytoplankton) use to produce food. By measuring chlorophyll in the water, researchers can get an idea of the health and productivity of the upper layers of the ocean.
Turbidity is a measure of how much matter is dissolved in water. Turbidity can be used to determine water conditions which can be used to monitor the health of an area. For example an area with lots of plankton growth has a lot of nutrients and a lot of turbidity. And area with minimal nutrients and not a lot of plankton growth would have a low turbidity.
CTD Instrument Data
View data with the ONC Plotting Utility
A CTD (Conductivity, Temperature, and Depth) instrument is one of the most widely used oceanographic instruments, as it measures a fundamental selection of important and useful variables - conductivity, temperature, density, salinity, pressure, and oxygen.
Weather Instrument Data
View data with the ONC Plotting Utility
A shore-based weather station has been installed at this location with instruments and equipment for measuring atmospheric conditions to provide information for weather forecasts and for further studies related to weather and climate.
This location provides measurements for Air Pressure, Humidity, Air Density, Air Temperature, Dew Point, Solar Radiation, Wind Direction and Wind Speed.
Hydrophone

Hydrophones are underwater microphones used to detect and record ambient sound in the ocean. Using hydrophones, scientists study marine mammal vocalizations, noise pollution such as that caused by shipping traffic, seismic activity and underwater landslides.
This image is a spectrogram, a visual representation of the sound frequency spectrum recorded by a hydrophone at this location.
This image shows the sound generated by a vessel approaching an anchorage, followed by a pause then the dropping of the ship’s anchor.
Shorestation Video
This time-lapse video was created from footage captured at the Digby Island Shorestation over a 24hr period for the date shown. This video can useful to monitor weather conditions over a period of time.
Underwater Video
Located at a depth of 28m, the lights for this underwater camera turn on for 5min every hour, allowing for observations of underwater activity without unduly impacting the sea life in the area.
When on-line, the camera allows for sea life monitoring as well as water properties such as turbidity (cloudiness).
Oceanographic Radar System
CODAR (Coastal Ocean Dynamics Applications Radar) is a radar technology that allows for the measurement and mapping of surface ocean current velocities.
A single CODAR system can measure only the component of surface current travelling toward or away from that radar, so to determine the total surface current vectors, it is necessary to use at least two CODARs.
For the Prince Rupert area, CODARs are installed at the locations shown on Digby Island and Ridley Island which allows for the production of the current map shown. These current maps are produced every hour by Ocean Networks Canada.
State of the Ocean Data

This continually updating plot shows the seasonal and annual changes in oxygen (O; purple), density (σ; blue), salinity (S; green), and temperature (T; red).
RIDLEY ISLAND
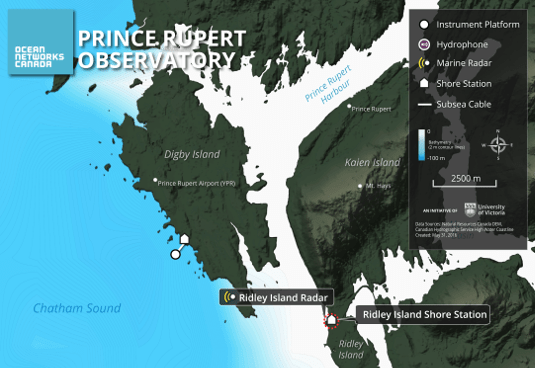
Ocean Networks Canada’s instrumentation on the west side of Ridley Island includes a second oceanographic radar system (CODAR). When triangulated with the Digby Island CODAR, the system produces surface ocean current maps within a radius of 20 – 30 kilometres.
Also at this site is another type of oceanographic radar (WaMos) that produces high-resolution views of wave heights and direction over a range of 4 kilometres.
The shore station hosts a weather station, a camera, and an automatic identification system (AIS) antenna used to track large vessels.
Latest Readings
This table shows the most recently recorded data points from a selection of instruments at this location.
Weather Instrument Data
View data with the ONC Plotting Utility
A shore-based weather station has been installed at this location with instruments and equipment for measuring atmospheric conditions to provide information for weather forecasts and for further studies related to weather and climate.
This location provides measurements for Air Pressure, Humidity, Air Density, Air Temperature, Dew Point, Solar Radiation, Wind Direction and Wind Speed.
Oceanographic Radar System
CODAR (Coastal Ocean Dynamics Applications Radar) is a radar technology that allows for the measurement and mapping of surface ocean current velocities.
A single CODAR system can measure only the component of surface current travelling toward or away from that radar, so to determine the total surface current vectors, it is necessary to use at least two CODARs.
For the Prince Rupert area, CODARs are installed at the locations shown on Digby Island and Ridley Island which allows for the production of the current map shown. These current maps are produced every hour by Ocean Networks Canada.
Shorestation Video
This video footage is a time-lapse of the previous 24-hr period from a camera located on Ridley Island, looking north towards Digby Island across the main shipping channel. This video can useful to monitor weather conditions and vessel traffic movements over a period of time.